Interferometry
Check out the paper on this new method and the code for optical interferometry of rotating, spotted stars.
Combining telescopes
Even if we look at the nearest star to the Sun with the biggest telescope in the world, we would see nothing but a ripple called an Airy disk, due to the wave nature of light. So astronomers rely on other techniques to map stars, usually less direct than taking a picture. The best and most direct of these is called interferometry, where you combine telescopes that are spaced far apart to get the resolving power of a huge telescope the size of the distance between the telescopes. It’s the closest you can get to taking a picture, even if it’s only been used a handful of times. But there are still gaps with interferometry. Each pair of telescopes gives you a single point on a Fourier transform (FT) at each moment in time, leaving large gaps in the frequency domain. We need to find a way to fill these gaps to invert the Fourier transform and get an image!
My approach
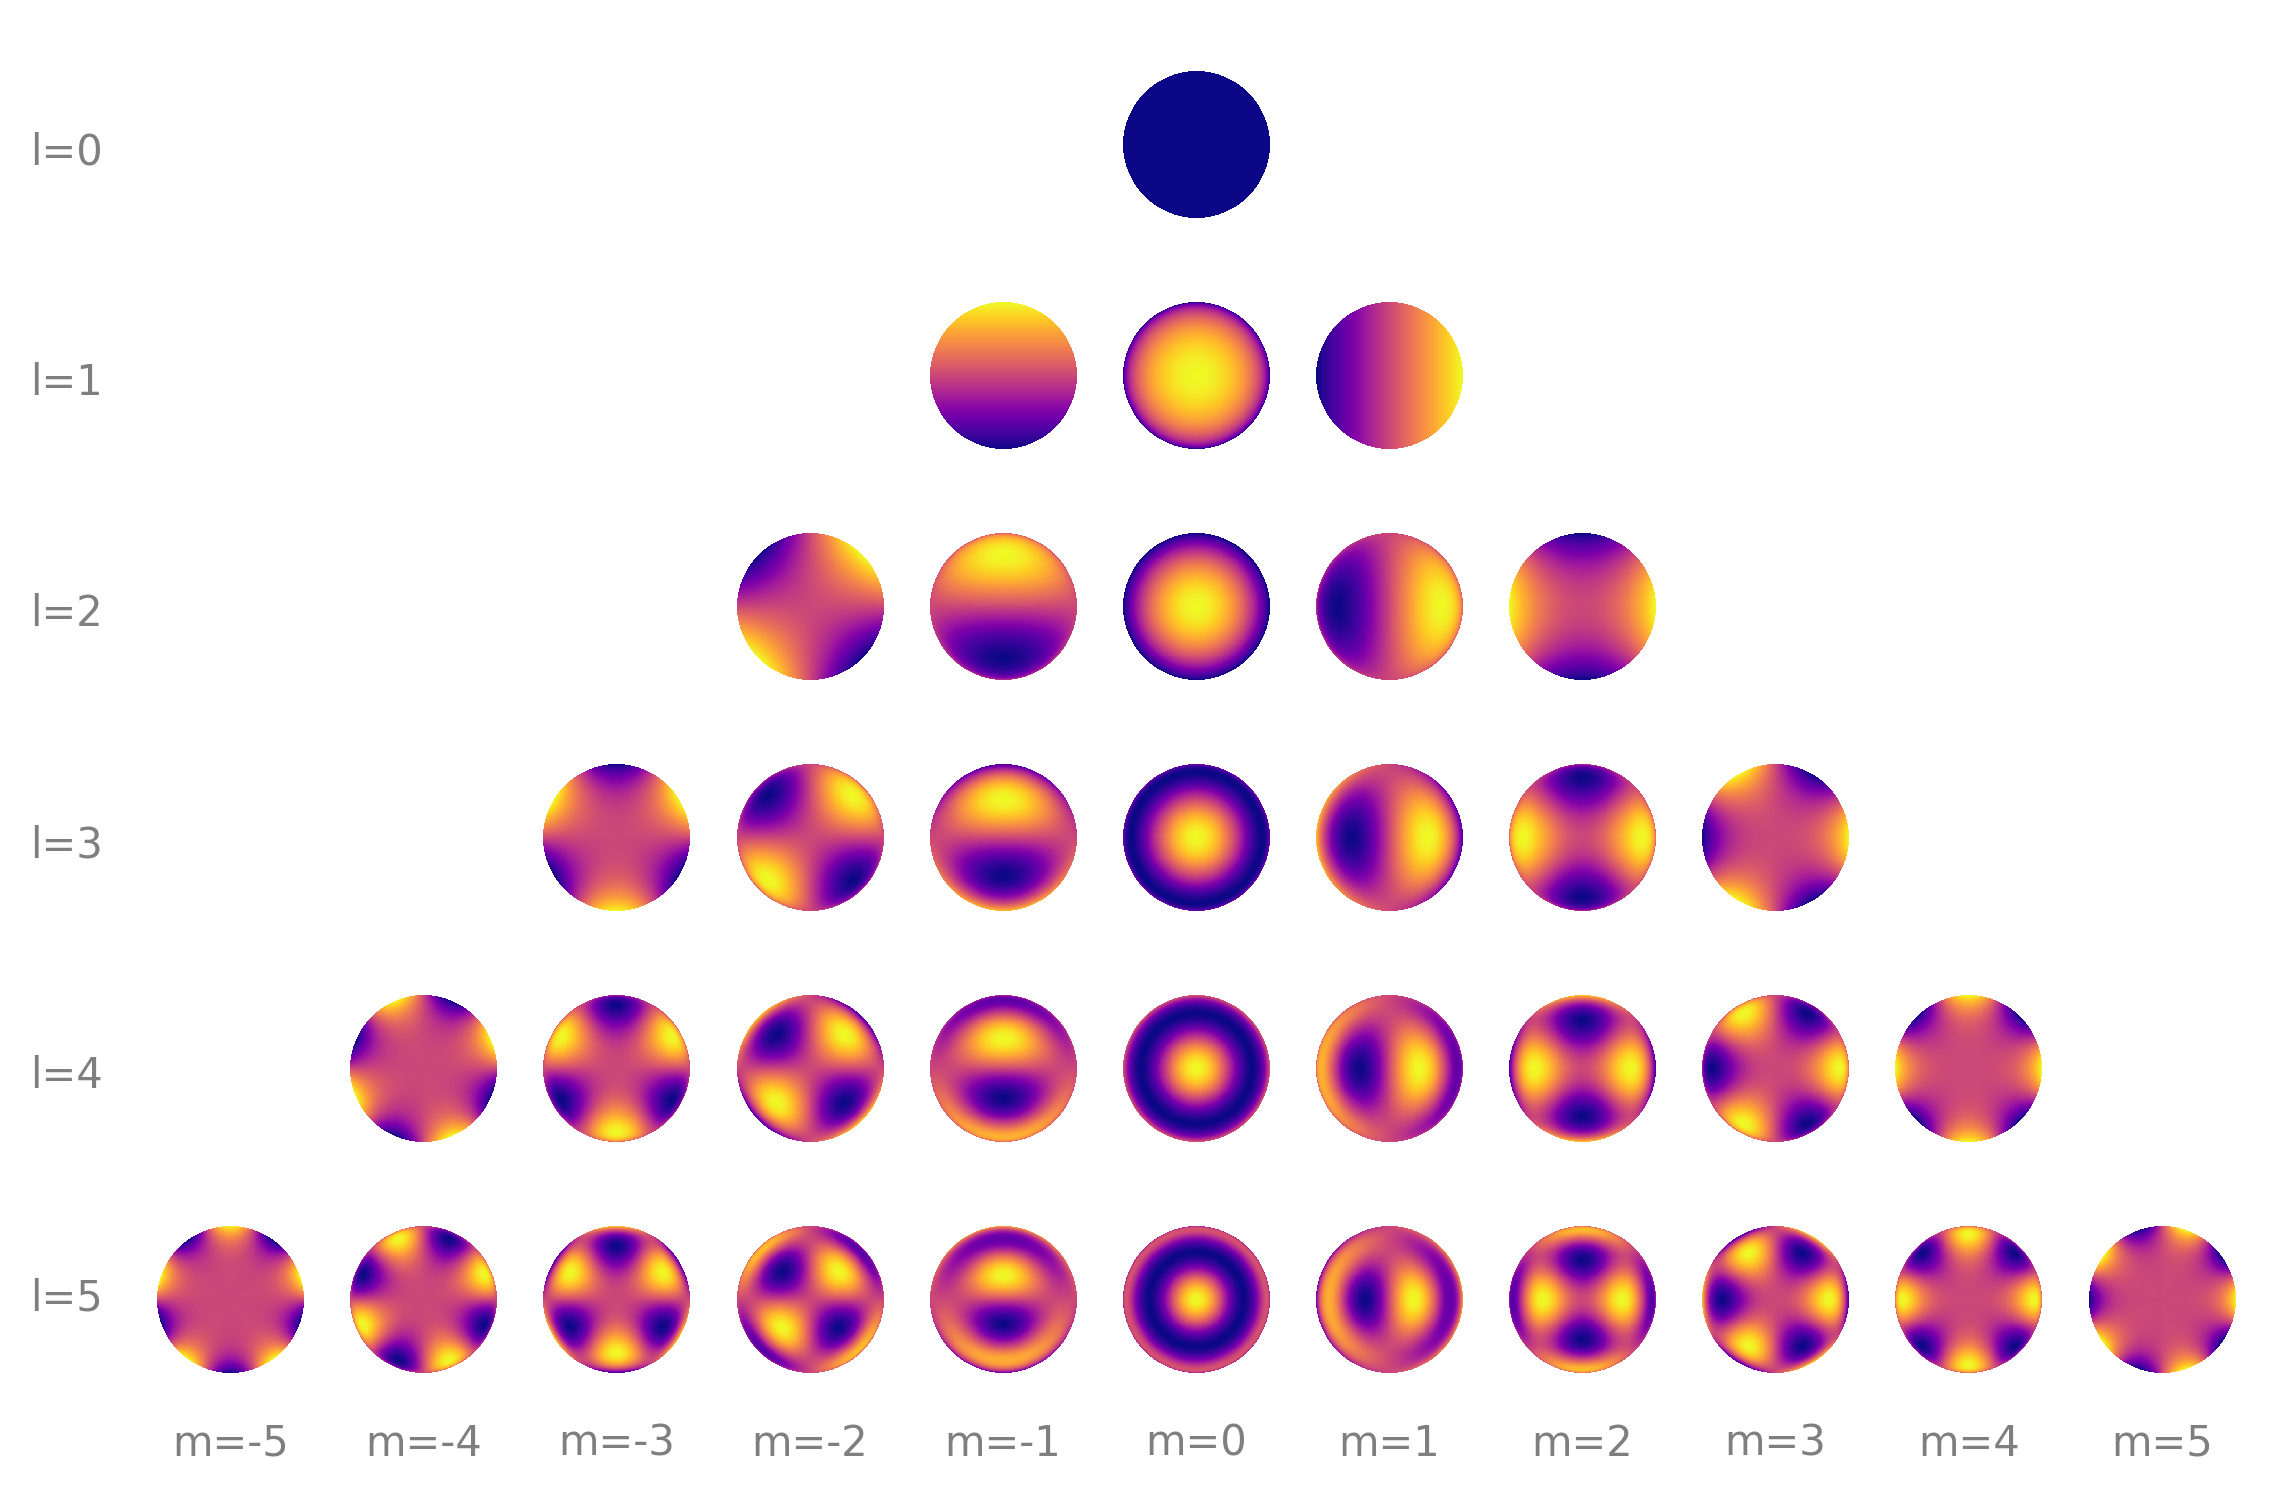
We can use our knowledge that our star has a spotty surface on a disk to reduce the number of solutions to our problem. If we know the star is rotating, we know the features on its surface will rotate along with it! In our paper, we use the spherical harmonics to represent the intensity on a star’s surface (figure from Luger et al. 2019:
With the star’s map described in spherical harmonics, we found a really neat analytic solution to its Fourier transform. This gives us the visibility function, which is closely related to what we measure from an interferometer. And the solution is linear with respect to the star’s map!
We implement this new math in a new Python/JAX package called harmonix, which is based on and designed to work with a suite of other JAX codes for mapping stars and planets.
The SPOT star
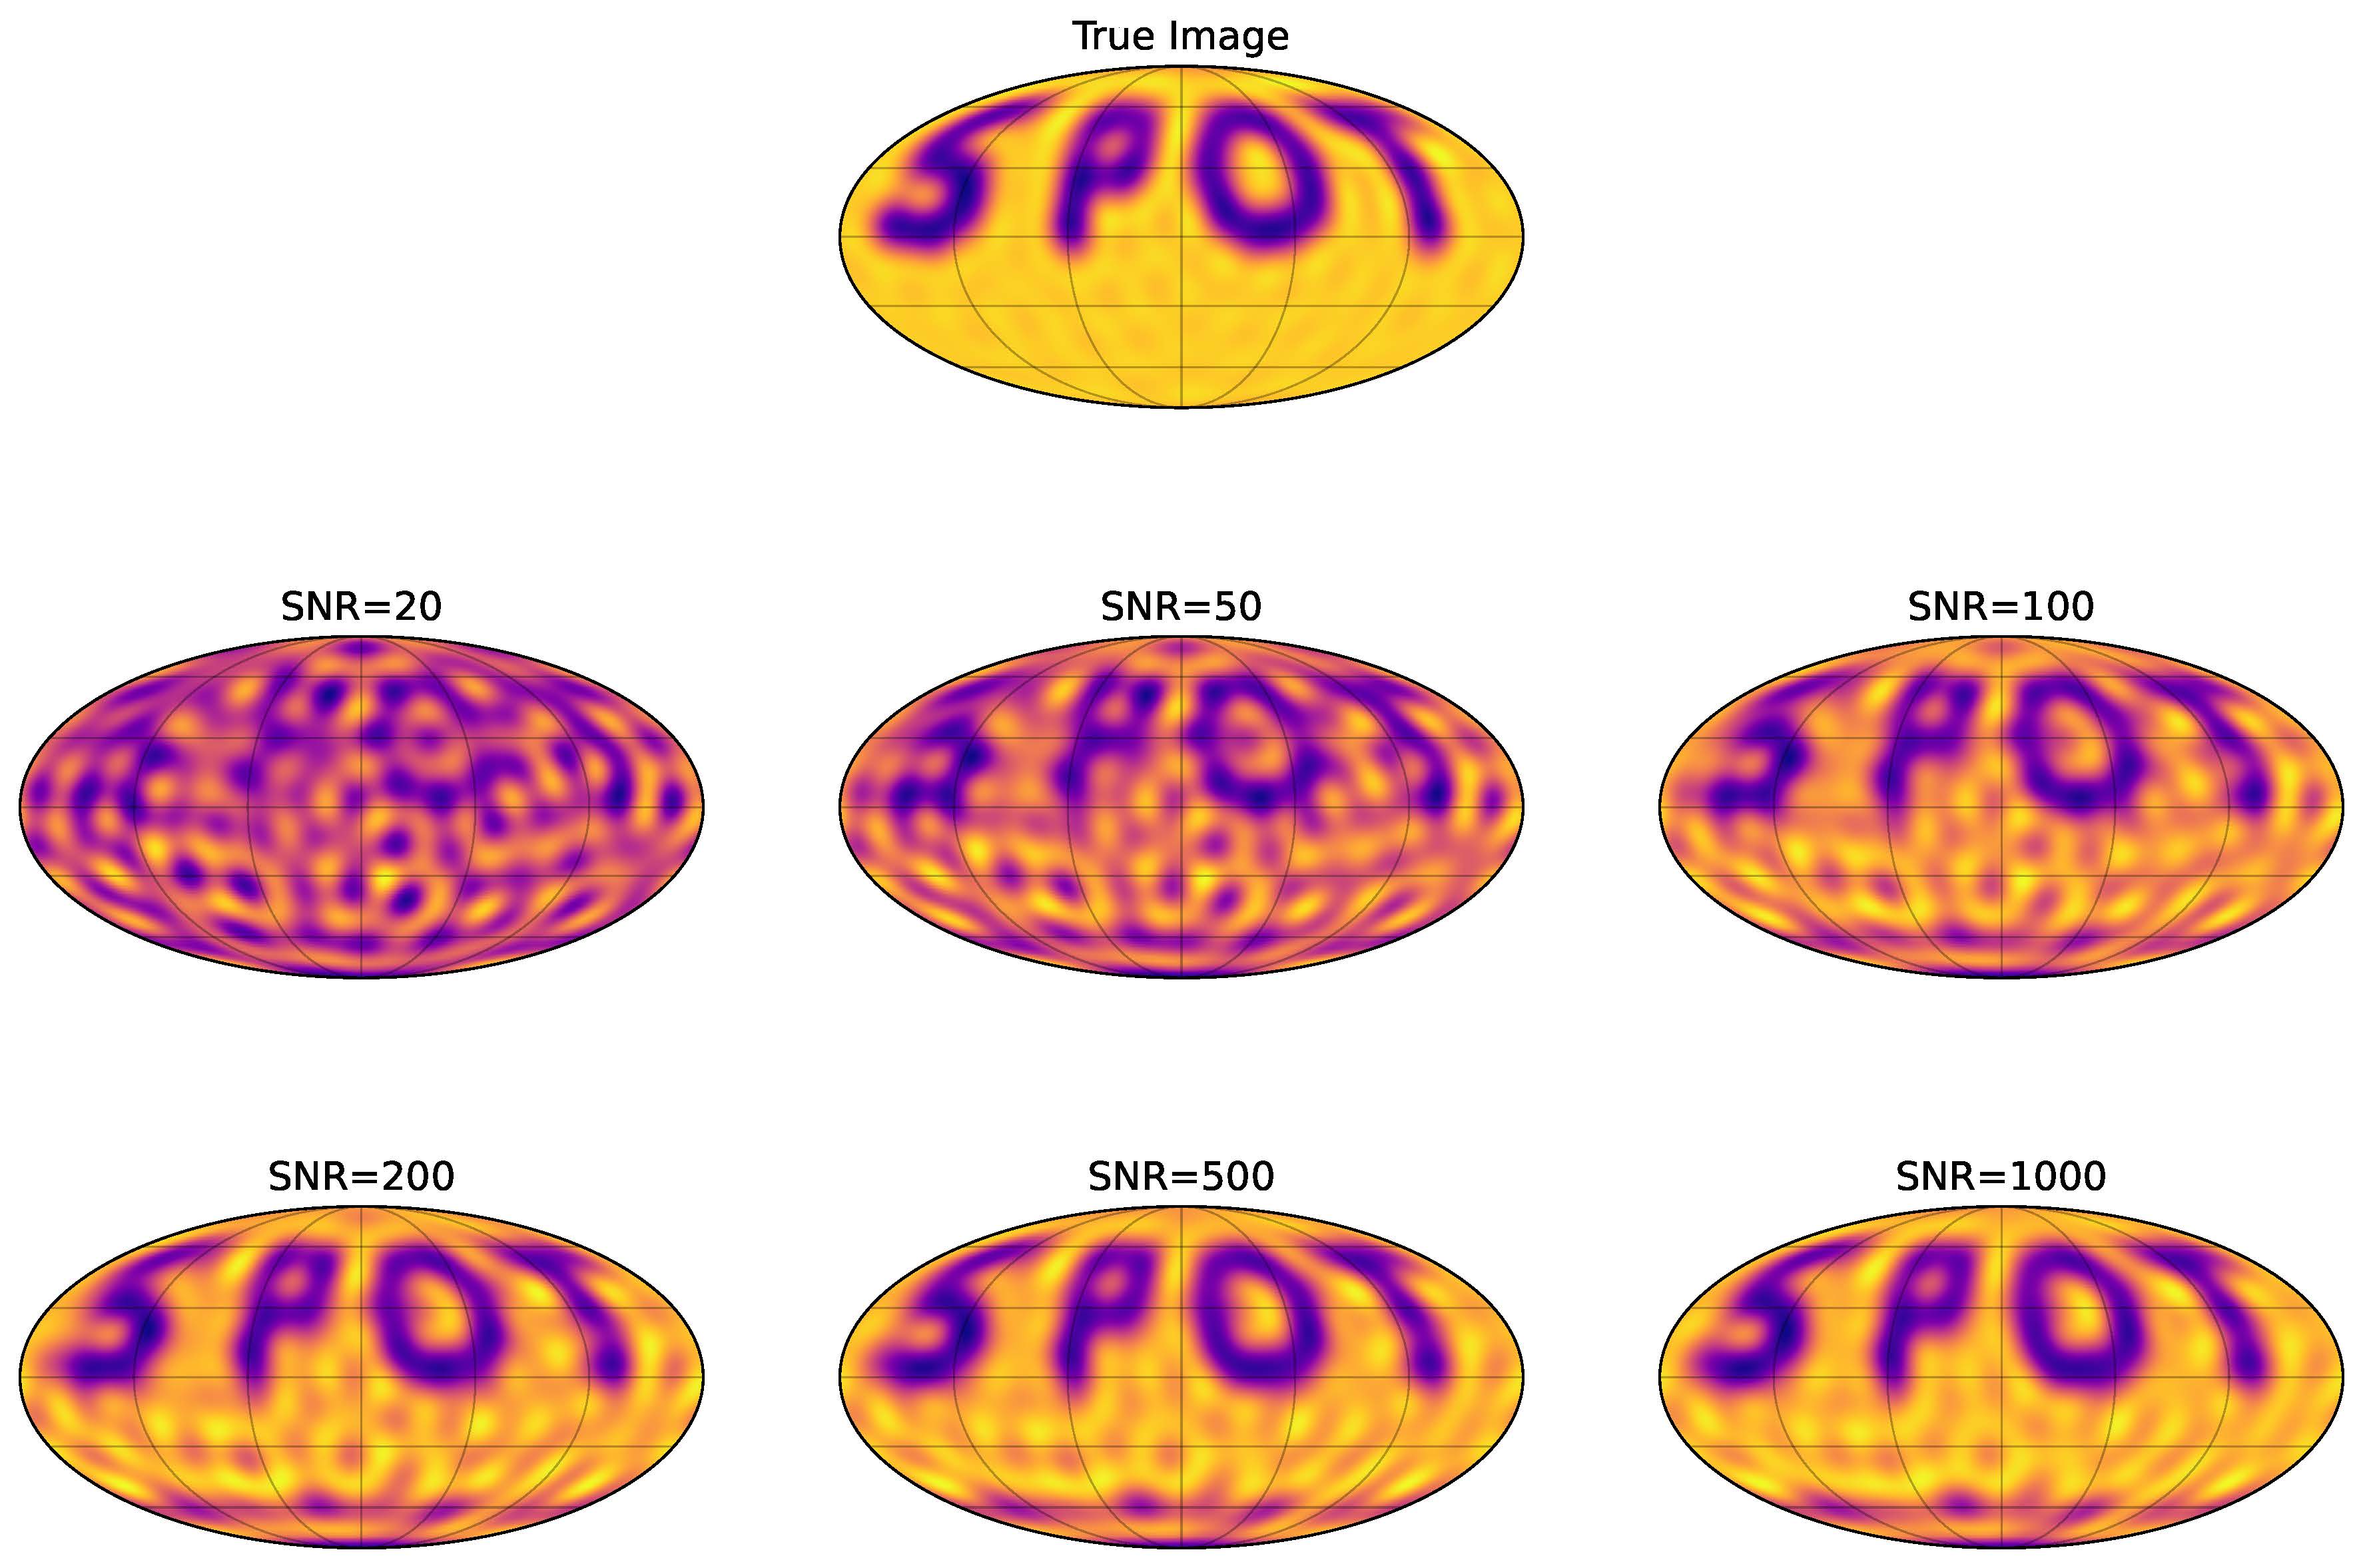
Armed with this new math and code, we set out to tackle a toy experiment first done for Doppler imaging spectroscopy by Vogt in 1987 but as far as I know, not tried for interferometry. Just like Luger et al. (2021), we paint a hypothetical star’s surface with the word ‘SPOT’. We then try to see if we can image this SPOT star using interferometry.
I simulate observing it with the CHARA Array and inject different levels of noise into the simulated data and optimize to find the best-fitting map. At high signal-to-noise we basically recover a perfect map!
Combining interferometry and photometry
One of the coolest results that came out of this work was the power of interferometry and photometry together. With tools like jaxoplanet/starry, which use the spherical harmonics to model rotational light curves, we can see the information gained by combining interferometry and photometry. We found that interferometry with arrays like CHARA lack information about the broadest spatial details of the star, the lowest order spherical harmonics. But photometry does really well at probing information on these modes, especially high-precision photometry from space telescopes like TESS! By combining these together, we can get nearly an order of magnitude improvement in the precision of the surface map.